The New School Accountability Regime in England: Fairness, Incentives and Aggregation
Author: Simon Burgess
The New School Accountability Regime in England: Fairness, Incentives and Aggregation
The long-standing accountability system in England is in the throes of a major reform, with the complete strategy to be announced in the next few weeks. We already know the broad shape of this from the government’s response to the Spring 2013 consultation, and some work commissioned from us by the Department for Education, just published and discussed below. The proposals for dealing with pupil progress are an improvement on current practice and, within the parameters set by government, are satisfactory. But the way that individual pupil progress is aggregated to a school progress measure is more problematic. This blog does not often consider the merits of linear versus nonlinear aggregation, but here goes …
Schools in England now have a good deal of operational freedom in exactly how they go about educating the students in their care. The quid pro quo for this autonomy is a strong system of accountability: if there is not going to be tight control over day to day practice, then there needs to be scrutiny of the outcome. So schools are held to account in terms of the results that they help their students achieve.
The two central components are new measures of pupils’ attainment and progress. These data inform both market-based and government-initiated accountability mechanisms. The former is driven by parental choices about which schools to apply to. The latter is primarily focussed around the lower end of the performance spectrum and embodied in the floor targets – schools falling below these triggers some form of intervention.
Dave Thomson at FFT and I were asked by the Department for Education (DfE) to help develop the progress measure and the accompanying floor target, and our report is now published. Two requirements were set for the measure, along with an encouragement to explore a variety of statistical techniques to find the best fit. It turns out that the simplest method of all is barely any worse in prediction than much more sophisticated ones (see the Technical Annex) so that is what we proposed. The focus in this post is on the requirements and on the implications for setting the floor.
The primary requirement from the DfE for the national pupil progress line was that it be fair to all pupils. ‘Fair’ in the sense that each pupil, whatever their prior attainment, should have the same statistical chance of beating the average. This is obviously a good thing and indeed might sound like a fairly minimal characteristic, but it is not one satisfied by the current ‘expected progress’ measure. We achieved this: each pupil on whatever level of prior attainment an expected progress measure equal to the national average. And so, by definition, each pupil has an expected deviation from that of zero.
The second requirement was that the expected progress measure be based only on prior attainment, meaning that there is no differentiation by gender for example, or special needs or poverty status. This is not because the DfE believe that these do not affect a pupil’s progress, it was explicitly agreed that they are important. Rather, the aim was for a simple and clear progress measure – starting from a KS2 mark of X you should expect to score Y GCSE points – and there is certainly a case to be made that this expectation should be the same for all, and there should not be lower expectations for certain groups of pupils. (Partly this is a failure of language: an expectation is both a mathematical construct and almost an aspiration, a belief that someone should achieve something).
So while the proposed progress measure is ‘fair’ within the terms set, and is fair in that it sets the same aspirational target for everyone, it is not fair in that some groups will typically score on average below the expected level (boys, say) and others will typically score above (girls). This is discussed in the report and is very nicely illustrated in the accompanying FFT blog. There are plausible arguments on both sides here, and the case against going back to complex and unstable regression approaches to value added is strong. This unfairness carries over to schools, because schools with very different intakes of these groups will have different chances of reaching expected progress. (Another very important point emphasised in the report and in the FFT blog is that the number of exam entries matters a great deal for pupil performance).
Now we come to the question of how to aggregate up from an individual pupil’s progress to a measure for the school. In many ways, this is the crucial part. It is on schools not individual pupils that the scrutiny and possible interventions will impact. Here the current proposal is more problematic.
Each pupil in the school has an individual expected GCSE score and so an individual difference between that and her actual achievement. This is to be expressed in grades: “Jo Smith scored 3 grades above the expected level”. These are then simply averaged to the school level: “Sunny Vale School was 1.45 grades below the expected level”. Some slightly complicated statistical analysis then characterises this school level as either a significant cause for concern or just acceptable random variation.
It is very clear and straightforward, and that indeed is its chief merit: it is easily comprehensible by parents, Headteachers and Ministers.
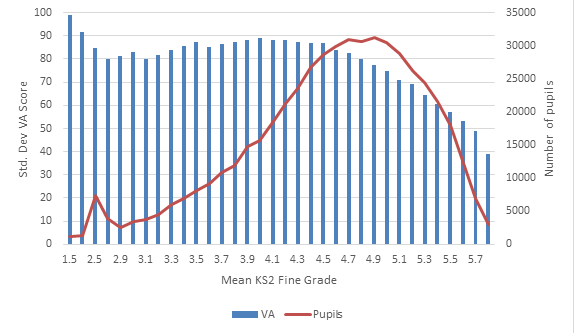
But it has two significant drawbacks, both of which can be remedied by aggregating the pupil scores to school level in a slightly different way. First, the variation in achieved scores around expected progress is much greater at low levels of attainment than at high attainment. This can be seen clearly in Figure 1, showing that the variance in progress by KS2 sharply and continuously declines across the range where the bulk of pupils are. Schools have pupils of differing ability, so the effect is less pronounced at school level, but still evident.
The implication of this is that if the trigger for significant deviation from expected performance is set as a fixed number of grades, then low-performing students are much more likely to cross that simply due to random variation than high-performing students are. By extension, schools with substantial intakes of low ability pupils are much more likely to fall below the floor simply through random variation than schools with high ability intakes are. So while our measure achieves what might be called ‘fairness in means’, the current proposed school measure does not achieve ‘fairness in variance’. The DfE’s plan is to deal with this by adjusting the school-level variance (based on its intake) and thereby what counts as a significant difference. This helps, but is likely to be much more opaque than the method we proposed and is likely to be lost in public pronouncements relative to the noise about the school’s simple number of grades below expected.
Fig 1: Standard deviation in Value added scores and number of pupils by mean KS2 fine grade (for details – see the report)
The second problem with the proposal is inherent in simple averaging. Suppose a school is hovering close to the floor target, with a number of pupils projected to be significantly below their progress target. The school is considering action and how to deploy extra resources to lift it above the floor. The key point is this: it needs to boost the average, so raising the performance of any pupil will help. Acting sensibly, it will target the resources to the pupils whose grades it believes are easiest to raise. These may well be the high performers or the mid performers – there is nothing to say it will be the pupils whose performance is the source of the problem, and good reason to think it will not be.
While it is quite appropriate for an overall accountability metric to focus on the average, a floor target ought to be about the low-performing students. The linear aggregation allows a school to ‘mask’ under-performing students with high performing students. Furthermore, the incentive for the school may well be to ignore the low performers and to focus on raising the grades of the others, increasing the polarisation of attainment within the school.
The proposal we made in the report solves both of these problems, the non-constant variance and the potential perverse incentive inherent in the averaging.
We combine the individual pupil progress measures to form a school measure in a slightly different way. When we compare the pupil’s achievement in grades relative to their expected performance, we normalise that difference by the degree of variation specific to that KS2 score. This automatically removes the problem of the different degree of natural variation around low and high performers. We then highlight each pupil as causing concern if s/he falls significantly below the expected level, and now each pupil truly has the same statistical chance of doing this. The school measure is now simply the fraction of its pupils ‘causing concern’. Obviously simply through random chance, some pupils in each school will be in this category, so the floor target for each school will be some positive percentage, perhaps 50%. We set out further details and evaluate various parameter values in the report.
The disadvantage of this approach for the DfE is that the result cannot be expressed in terms of grades, and it is slightly more complicated (again, discussed in the report). This is true, but it cannot be beyond the wit of some eloquent graduate in government to find a way of describing this that would resonate with parents and Headteachers.
At the moment, the difference between the two approaches in terms of which schools are highlighted is small, as we make clear in the report. Small, but largely one way: fewer schools with low ability intakes are highlighted under our proposal.
But there are two reasons to be cautious. First, this may not always be true. And second, the perverse incentives – raising inequality – associated with simple averaging may turn out to be important.
Visit the CMPO Website

